1. Introduction #
The DialForce Dashboard is a real-time performance and analytics console designed for supervisors, managers, and administrators.
It provides complete visibility into:
- Agent call performance
- Live call activity
- Historical call data
- CTI number usage
- Call responsiveness and SLAs
Using the dashboard, teams can track inbound and outbound activity, monitor agent availability, and evaluate calling efficiency directly inside Salesforce.
The dashboard includes four major components:
- CTI Filter
- CTI Insights
- Real-Time Call Monitoring
- Call Log History
2. Pre-Requisites #
Before using the DialForce Dashboard, ensure the following:
- The user has access to the DialForce Dashboard and related objects.
- Agents are properly mapped to their CTI Numbers.
- Call logs and data syncing are active in Salesforce.
Note:
When you select a CTI Number, the Agent dropdown will automatically display only the agents assigned to that CTI Number.
3. Dashboard Components Overview #
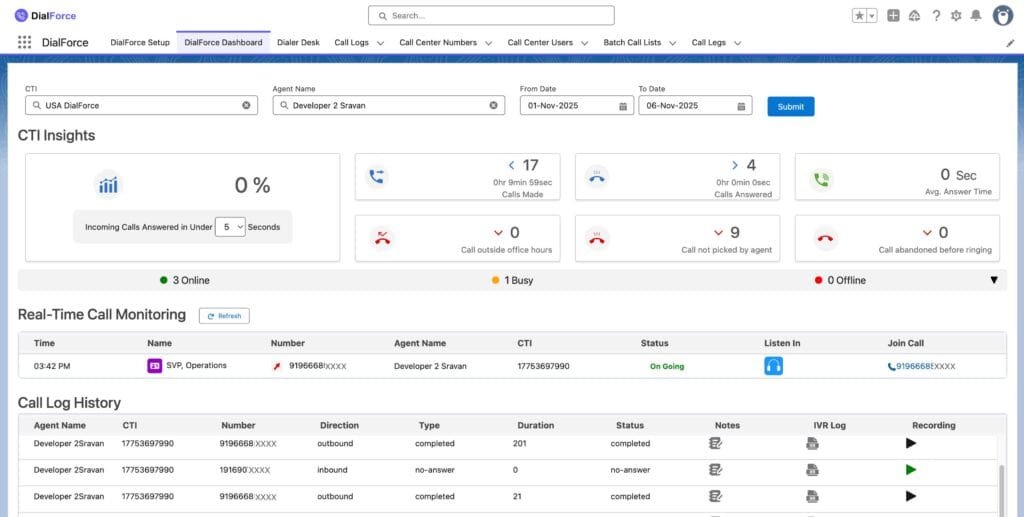
3.1 CTI Filter #
The CTI Filter is the control panel for refining the data displayed across the dashboard.
How to Apply Filters #
- Open the DialForce Dashboard
The filter bar will be displayed at the top. - Select CTI Number
- Choose the CTI Number you want to review.
- The Agent dropdown will auto-update based on this selection.
- Choose the CTI Number you want to review.
- Select Agent(s)
- Choose one or multiple agents.
- You can use the search box to find agents quickly.
- Choose one or multiple agents.
- Select Date Range
- From Date – start of reporting period
- To Date – end of reporting period
- From Date – start of reporting period
- Submit Filter
Click Submit to refresh all sections:- CTI Insights
- Call Log History
- Real-Time Call Monitoring
- CTI Insights
3.2 CTI Insights #
The CTI Insights section provides a summary of agent performance based on your filter selections.
It highlights productivity, responsiveness, missed call volume, and SLA-based behavior.
This section updates automatically each time you adjust filters or change the call threshold timer.
Incoming Calls Answered Under [Seconds] #
At the top of CTI Insights, you can select a time threshold—for example:
- 10 seconds
- 20 seconds
- 30 seconds
Once selected, the dashboard recalculates the number of incoming calls answered within that duration.
This helps supervisors evaluate responsiveness and SLA adherence.
Performance Metrics Explained #
1. Calls Made #
Displays:
- Total outbound calls made by selected agent(s)
- Total connected call duration
Use this to understand outbound productivity and customer engagement quality.
Example:
398 outbound calls were made, totaling 2 hours, 21 minutes, 39 seconds of talk time.
2. Calls Answered #
Shows:
- Total inbound calls successfully answered
- Total talk duration across these calls
This helps measure how often agents respond to incoming customer communication.
Example:
109 calls answered with a combined duration of 4 minutes, 55 seconds.
3. Average Answer Time #
Shows:
- Average time taken to answer calls that fall under the selected threshold
- Total combined answer duration
A lower value indicates higher responsiveness.
Example:
Average answer time: 0.31 seconds
4. Calls Outside Office Hours #
Displays the number of calls received beyond business working hours.
This helps organizations understand after-hours demand and plan staffing accordingly.
Example:
14 calls were received outside business hours.
5. Calls Not Picked by Agent #
Shows the number of incoming calls that were not answered.
This helps identify:
- Under-staffing
- Missed customer opportunities
- Response delays
Example:
281 calls were not answered by the assigned agent.
6. Calls Abandoned Before Ringing #
Displays incoming calls that customers ended before ringing reached the agent.
This can indicate:
- Customer impatience
- Network delay
- IVR complexity
- High call volume
Example:
0 calls abandoned before ringing.
Real-Time Agent Status #
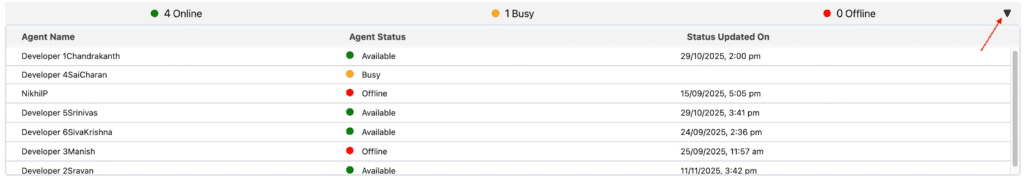
Supervisors can view an agent’s live status:
- Online
- Busy
- Offline
The dropdown also shows the last updated timestamp, allowing supervisors to track recent agent activity.
3.3 Real-Time Call Monitoring #
This section allows supervisors to monitor live call activity.
How to Use: #
- Click Refresh to load the latest live calls.
- Each active call displays:
- Customer Name
- Customer Number
- Agent Name
- CTI Number
- Call Start Time
- Call Status (ongoing, completed)
- Join Call option
Listen In / Join Call #
If your profile has permission:
- Use Listen In to silently monitor an agent’s ongoing call.
- Use Join Call to enter the call via conference for assistance or escalation.
This feature is ideal for:
- Quality assurance
- Training
- Live customer support intervention
3.4 Call Log History #
This section shows historical call details for the selected CTI Number, Agent, and Date Range.
Each entry includes:
- CTI Number – number used by the agent
- Customer Number
- Call Direction (Inbound / Outbound)
- Call Status (Completed, Missed, Canceled)
- Call Duration
- Agent Notes
- Call Recording (available for playback)
This is the primary area for checking past interactions, reviewing customer communication, and validating agent logs.
4. Summary #
The DialForce Dashboard provides a complete overview of agent calling performance.
It enables supervisors to:
- Analyse inbound and outbound activities
- Measure SLA adherence
- Monitor live calls
- Review detailed call logs
- Evaluate agent responsiveness and productivity
With these insights, organizations can improve customer experience, optimize staffing, and maintain high-quality call operations within Salesforce.


